Activity Log
You can view a log of activities or events that have occurred on the server. You can then export or print the results.
Before you start
You must have System Set Up selected in the Admin tab of your General Access security role.
The period used to define how long event information is stored in the activity log is configured using the Expire Event Messages field in the System Settings window.
- Select the Menu button
 , then Admin, and then select System Administration. The System Administration window is displayed
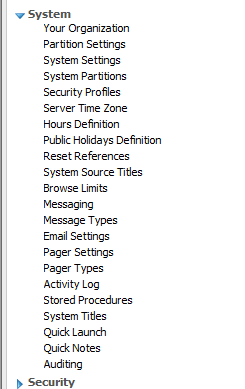
  . In the Explorer pane, locate the System group
  , scrolling up or down if necessary. You may need to expand the group to see the options within it.
 - Select the Activity Log option on the Explorer pane. The Activity Log window appears. At the top of the window there are fields in which you specify the activity log you want to view:
- If your system is partitioned and you want to filter your view by a specific partition, select a partition from the Partition list on the far right of the window.
- You can choose from the following actions from the Activity Log window:
- Select the Clear Date’s Events toolbar button
 to clear all events from the table for the selected date.
 - In the message asking you if you want to delete all events prior to the selected date, select from:
|
Event Source |
Select from the drop down list of event sources:
|
||||||||||||||||||||||||
| Date | The date for which you want to view the activity | ||||||||||||||||||||||||
| View Type | Use the radio button to select the type of activity you want to view |

|
to print the information |

|
to export the results to an Excel file |

|
to export the results to an XML file |

|
to export the results to a text file |
|
Yes |
To delete all events prior to the selected date |
|
No |
To delete the events for the selected date |
|
Cancel |
To return to the events view without deleting any set of events |